Finding a tricky bug in Elasticsearch 8.4.2
A few weeks ago, I helped to find a bug in Elasticsearch 8.4.2. We’d started seeing issues in our Elastic cluster at work, and I was able to isolate the issue in a small, reproducible test case. I shared my code with Elastic engineers, and that helped them identify and fix the problem.
I was pretty pleased with my bug report – it was a simple, self-contained example with an obvious smoking gun. A previously elusive bug became reproducible, which led straight to the faulty code.
I got there with a classic debugging cycle: find a reproducible error, delete something, see if the error reproduces. Repeat until there’s nothing left to delete.
I thought it might be interesting to walk through the process; to explain my steps and my thinking. Every bug is different, but the same techniques appear again and again. Even if you don’t use Elasticsearch, I hope this will give you some ideas for debugging your next error.
Uh oh, something’s up
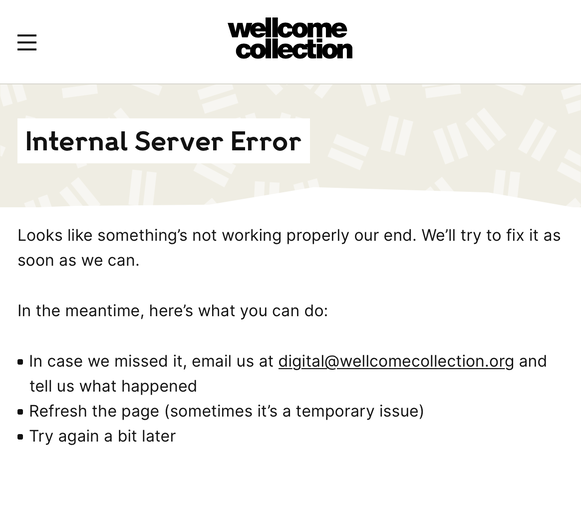
On the Thursday in question, we started getting alerts from our website monitoring – some people searching our collections were getting error pages:

As a proportion of overall traffic, it was pretty small – but alerts like this started to pile up in Slack. Even if it wasn’t completely down, the website was having issues.
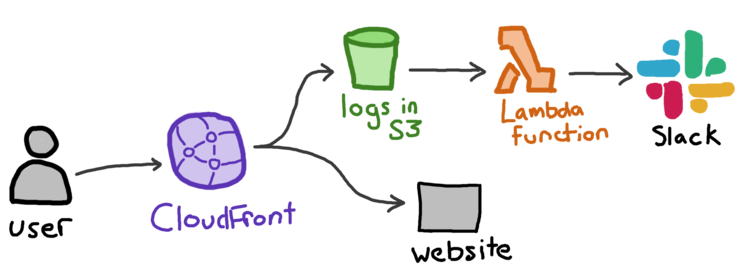
These alerts come from CloudFront. We run CloudFront in front of the website, and we upload our access logs to an S3 bucket. There’s a Lambda that gets notified of uploads in that bucket, and it scans every new log file. If it sees any 5xx server errors, it posts an alert to Slack. CloudFront uploads logs every few minutes, so we find out about issues pretty quickly.

Before this setup, we only found out about outages from our automated uptime monitoring (which only checks a sample of pages) or when a user reported an error (which are much slower to arrive). Getting near-realtime alerts of unexpected errors means we can fix them much faster.
As the errors stacked up in Slack, the meaning was obvious: something had gone bang.
Is it just me, or is something broken?
The Slack alert includes the affected URLs, so we can click to go straight to the failing page. This is intentional: trying to reproduce the error is the first step of debugging, and putting the URLs in Slack makes it as easy as possible to reproduce a failing request.
When we clicked, we all saw the error page – these searches were failing for us, and they were failing consistently.

We discovered that some – indeed, most – searches were still working, and they worked consistently. For example, searches for “SA/DRS/B/1/17 Box 2” would always fail, but searches for “bolivia” would always succeed.
Although annoying, this was a good first step: we had a reproducible error. That’s much easier to debug than something flaky or intermittent.
Now we had to find out where it was coming from.
Following the error through our code
This is the basic architecture for our collections search:

If you’re using our website, you’re interacting with a front-end web app. That web app is making requests to our Catalogue API, which in turn is sending queries to an Elasticsearch cluster. The cluster contains all of the catalogue data.
I started by looking in the logs for the front-end web app. They didn’t contain anything useful, just “I’m returning a 500 error for this page”. After looking at the code, I discovered it could give an unexplained error if it got a 500 error from the catalogue API. I added a new log, rechecked the page, and I could see it was indeed forwarding an API error.
I often make small improvements like this when I’m debugging: I’m not just trying to fix the immediate issue, I’m trying to make it easier for the next time I go debugging.
Then I looked in the logs for the catalogue API. It was giving a slightly more descriptive error, even if it was one I didn’t recognise:
Sending HTTP 500 from ElasticsearchErrorHandler$ (Unknown error in search phase execution: ElasticError(illegal_argument_exception,totalTermFreq must be at least docFreq, totalTermFreq: 325030, docFreq: 325031,None,None,None,null,None,None,None,List());…
This was another step forward: now I had something to Google.
Is this an Elasticsearch bug?
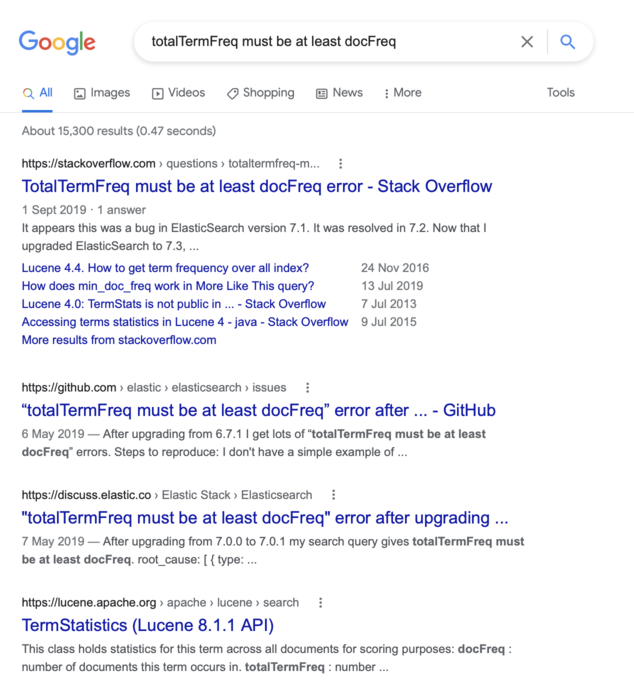
Whenever I get an error message I don’t recognise, I start by plugging it into Google:

There’s a knack in knowing which part of an error message to Google: some bits are generic and likely to turn up useful advice, some bits are specific and will be slightly different for everyone. The phrase “totalTermFreq must be at least docFreq” stood out to me as something likely to appear every time this error occurs; the individual document counts less so.
I don’t have good advice here except to say that Googling error messages is a skill, and you can get better with practice.
There aren’t many other people hitting this error, but there’s a common strand: everyone had issues after they upgraded Elasticsearch. And that’s when I remembered we’d just gone from 8.4.1 to 8.4.2.
(I’d forgotten because we hadn’t upgraded deliberately, but accidentally. We manage our Elastic Cloud clusters in Terraform and tell them to use the latest version of 8.4.x. I’d been making some unrelated Terraform changes, and that upgraded the cluster at the same time – but the upgrade wasn’t front of mind. We’ve now changed this Terraform so that it won’t upgrade clusters after they’re created. Once a cluster is created, it stays on the same version until manually upgraded.)
Then I looked at the list of Elasticsearch releases: 8.4.2 had been released just two days prior.

Uh oh.
This is the first time I suspected this might be an Elasticsearch bug. I’m usually loathe to point the finger at upstream providers – while nobody is infalliable, these are services with lots of users. Most bugs are going to be spotted by somebody else before they affect us. If something has gone wrong that isn’t affecting anybody else, it’s more likely my mistake than theirs.
But how many people upgrade within 48 hours? Maybe we were the first users to hit this bug.
The 8.4.2 release was the obvious culprit, so we started a rollback plan. We created a new cluster on an older Elasticsearch version and began loading in our data, so we could point the catalogue API away from the broken instance. We didn’t (yet) have proof that 8.4.2 was responsible, but it seemed plausible and indeed this fix did stop the errors.
I could have stopped here, but weird bugs like this are rare. I enjoy a deep debugging session, so I decided to investigate further.
Finding a minimal query
I started investigating in Kibana, because we already had that available in our cluster. If you open the dev tools, there’s a console where you can run queries.
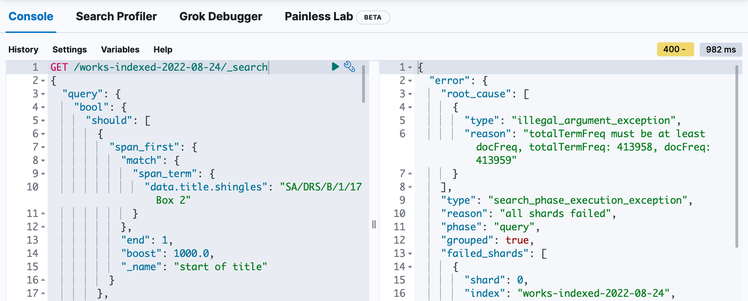
When the catalogue API gets an unexpected error from Elasticsearch, it logs the query it was trying to make. I plugged in that query, and bam, I got the same error:

This was a big clue: because we could reproduce the error inside Elasticsearch, we could ignore all of the code in the front-end app and the catalogue API. If debugging is like a murder mystery, this was like finding two cast-iron alibis.
I don’t have a great understanding of what the query does or how it works, but I didn’t need to – it’s just a JSON object. I started deleting bits, re-running the query, and checking to see if I still got an error. If the error stuck around: great, whatever I just deleted wasn’t important. If the error went away: put it back, that was significant.
Eventually a colleague and I managed to reduce a 150+ line query down to this:
GET /works-indexed-2022-08-24/_search
{
  "query": {
    "bool": {
      "should": [
        {
          "multi_match": {
            "query": "1",
            "fields": [
              "data.physicalDescription",
              "data.edition",
              "data.notes.contents"
            ],
            "type": "cross_fields",
            "operator": "And",
            "_name": "data"
          }
        }
      ]
    }
  }
}
Although this was only part of the reproduction, it was a useful clue: in particular, it helped identify the handful of fields that were actually interesting. The cross_fields query was also a hint: it was the culprit in one of the previous bugs I found through Google, although I didn’t make the connection immediately.
Reducing the size of the data
The last time somebody had this issue, they had difficulty creating a reproduction:
I don’t have a simple example of how to reproduce because it only happens when I index tons of data.
They don’t say explicitly, but I suspect “give Elastic a complete copy of the index” wasn’t an option – for most users, their databases contain proprietary information they can’t just give away. Their data sets are also large and unwieldy to move around, even if they wanted to.
Fortunately for me, all the data in our catalogue index is publicly available and permissively licensed. There are no rights issues with sharing the data (we have snapshots for download), so I knew that if I could get a smaller reproduction, I could share the data.
Our API index spans ~3M documents and ~50GB of storage. That’s pretty small by Elasticsearch standards, but still too big to share easily.
Because I knew the query reproduction was only looking at three fields, I could write a Python script to download just those fields. (I suppose it’s possible that a non-queried field could affect the result, but that would be very strange!)
with open("documents.json", "w") as outfile:
    for hit in scan(
        es,
        scroll="1m",
        _source=["data.physicalDescription", "data.edition", "data.notes.contents"],
        index="works-indexed-2022-08-24",
    ):
        outfile.write(json.dumps(hit) + "\n")
This alone made a big saving – the file it created was ~600MB.
This gave me a file with raw Elasticsearch hits:
{"_index": "works-indexed-2022-10-04", "_id": "qpugxbb6", "_score": null, "_source": {}, "sort": [0]}

{"_index": "works-indexed-2022-10-04", "_id": "v7tb52v3", "_score": 0, "_source": {"data": {"notes": [{"contents": "ESTC T90673"}, {"contents": "Electronic reproduction. Farmington Hills, Mich. : Thomson Gale, 2003. (Eighteenth century collections online). Available via the World Wide Web. Access limited by licensing agreements."}], "physicalDescription": "[4], xlviii, [16] p, 2144 columns ; 20."}}, "sort": [0]}
I did a bit more filtering with tools like jq and grep to extract just the _source field, and remove any empty documents (not all our records use those fields). I also removed values that never contained the number 1, as surely they’d be excluded by the query.
{"data": {"notes": [], "physicalDescription": "[4], xlviii, [16] p, 2144 columns ; 20."}}This cut another decent chunk off the size – compressed it was ~30MB, much more manageable. Now I had to check I hadn’t cut too far, and that this would still reproduce the issue.
Finding different versions of Elasticsearch
If I wanted to prove this was a bug introduced in 8.4.2, I had to do two things:
- Show that the error doesn’t occur in 8.4.1
- Show that the error does occur in 8.4.2
We use Elasticsearch Docker images for CI/CD, and I knew they were published for every version. I pulled two images to my local machine, which I could run to get the different versions:
$ docker pull docker.elastic.co/elasticsearch/elasticsearch:8.4.1
$ docker pull docker.elastic.co/elasticsearch/elasticsearch:8.4.2
Now I needed to index my reduced data set, and see if I can spot the error.
Creating a local debugging loop
I wrote another Python script which would:
- Create an index with a random name (so I could reuse the same Elasticsearch instance)
- Apply a mapping to the index
- Index all the documents
- Run a query against the index, see if it errors
I could use this with the minimal query I’d already found, and my reduced data set, and test against different versions of Elasticsearch. With the reduced data set, this took less than a minute each time, which is a relatively fast debugging loop.
I started with our original mapping, and kept deleting fields. Our index mapping has a lot of analysers and fields that were unlikely to affect this error (like parsing the title in multiple languages). I deleted bits of the mapping and re-ran the script, checking the error kept occurring.
I also flattened the documents. The first version of the query has a data. prefix in the field names, which reflects the structure of the complete index – but we don’t need that to reproduce the error.
By running this script repeatedly with both Docker images, I could see the error occurring on 8.4.2 and not 8.4.1. I tried some other changes to shrink the data set further, like halving the number of documents – but they made the error intermittent, and it was already pretty small.
This is when I stopped and started writing up an issue on the Elasticsearch repo.
It’s never that simple
This write-up makes it seem like a much more deliberate and intentional process than it actually was. Debugging isn’t linear – there are always false starts and wrong guesses between you and the solution. Experience helps – every time I debug a tricky problem, I spot the dead ends more quickly, but I’ll never avoid them entirely.
The artificial nature of this post aside, there are some useful lessons here:
-
Fast feedback loops are incredibly helpful. Once I had the final Python script, I was able to move quickly – I’d make a change, kick off a run, and have an answer within a minute. I could even run multiple experiments simultaneously, to get more data.
-
Always look for ways to make it easier to debug next time. On this occasion, it was tricky to trace the error from the front-end web app to the catalogue API. That’s the sort of thing we might do again, so I improved the logging in that part of the code.
-
Good communication saves time: I should have opened an Elasticsearch issue sooner. “I’ve found a bug, I’m working on a repro.” It would have avoided duplication of effort, both from me and the other Elastic engineers I didn’t know were already looking at this bug.
More broadly, take this as a case study in writing useful test cases: find a reproducible error, delete something, see if the error reproduces. Repeat until there’s nothing left to delete.
Admittedly, step 1 is often the hard bit, and I got lucky to land on a reproducible error so quickly. Even so, I’m proud of the bug report I was able to write. I think it’s clear, it contains useful information, and my example made it easy to track down the faulty code.
This was fun. I don’t often get a chance to do deep debugging, especially in an unfamiliar system – it’s nice to know I can still manage when the need arises.